
Logos are one of the most impactful design elements in marketing, often in ways that are not immediately obvious. As visual beings, humans are significantly influenced by logos; they can affect consumer emotions, shape investors’ perceptions of credibility, and clarify a company’s brand identity. Logos appear everywhere, from websites and products to reports and storefronts, making them one of the most visible and consistently encountered aspects of a brand.
When a brand makes the risky decision to change its well-known logo, it must be done with careful consideration, because people are sure to notice. Whether a brand is adapting to modern screens or appealing to new markets, the decision to execute a brand refresh is rarely made lightly. When done right, it can be a major boost to sales.
The team at LogoMaker wanted to identify which redesigns most benefited major brands, so today we’re reviewing 35 logo redesigns that significantly increased web traffic.
Logos and Brand Identity
Logo redesigns aren’t done for simple aesthetics. Instead, they’re a choice to change a brand’s overall image. For consumers, logos are a form of marketing shorthand that links a brand to certain expectations about a product. For that reason, even small changes in a logo’s design can change the associations that come with that brand.
Every aspect of a logo, from shape and composition to color choices and overall design, influences how consumers perceive the business it represents. According to the Harvard Business Review, descriptive logos, such as those with textual or visual elements that represent the product or service a brand offers, are generally seen as more authentic and appealing to consumers. For example, a coffee shop with a coffee cup in its logo is likely to be more successful than one whose design does not indicate that it sells coffee.
By contrast, abstract symbols can work well but usually require more intensive marketing or prior brand awareness to achieve the same level of recognition. The Starbucks logo is a good example of an abstract design that has become increasingly simplified over time, driven by its strong brand recognition. Originally, the siren image included the words “Starbucks Coffee.” Now it’s simply the white and green siren, with no direct indication of the product. Yet because Starbucks is a leading coffee brand, it can use a more abstract logo while maintaining its marketability.
That said, even when a design is effective initially, a logo’s lifespan isn’t infinite. As markets shift, a brand refresh may become necessary, either when a company outgrows its original market or when the industry as a whole has changed. When an established business designs a new logo, it often struggles to retain its brand identity while appealing to modern audiences.
Web Traffic as a Metric of Success
It’s often said that people vote with their dollars, but they also vote with their clicks. While web traffic doesn’t directly measure people’s opinions, it does reflect behavior. When web traffic rises after a logo redesign, it suggests that awareness has increased or interest has been rekindled.
For our purposes, we focused on Semrush organic traffic estimates for major brands that have overhauled their image since 2012. We compared average organic traffic for the three months leading up to the rebrand announcement with traffic during the launch month and the two months that followed. This approach allowed us to isolate the impact of the rebrand on traffic rather than the brand’s overall slow growth.
The Most Successful Logo Redesigns
One of the most interesting findings in the data is that brands that gained traffic after redesign launches were often those that took the biggest risks or tied the new look to a significant corporate rebranding.
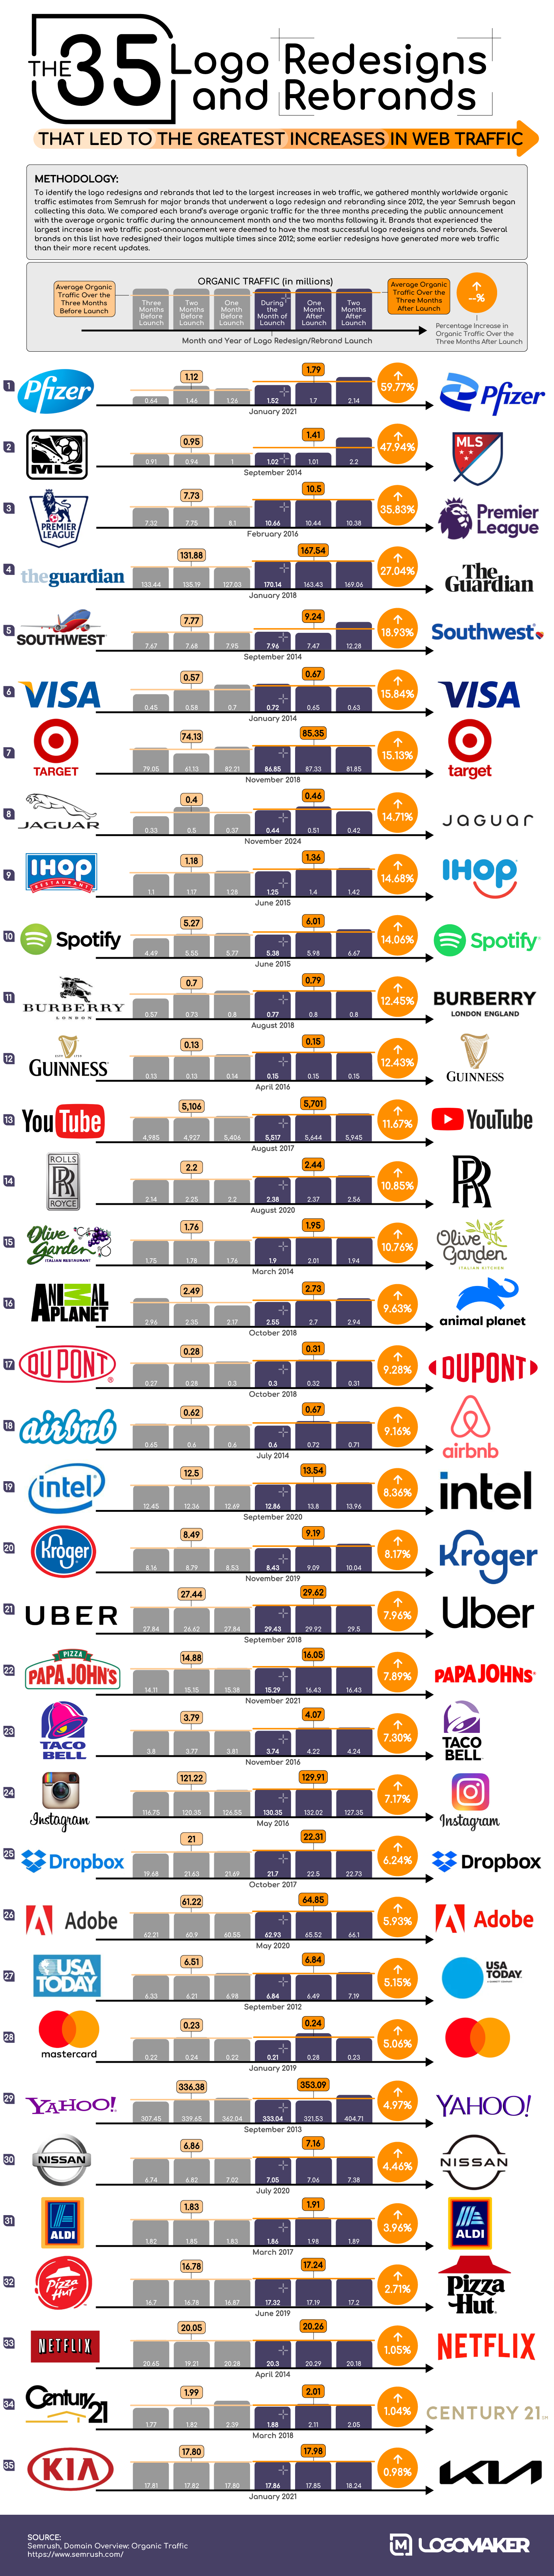
Pfizer leads the rankings with the largest percentage increase in traffic following its 2021 logo redesign. The pharmaceutical brand moved from its pill-shaped logo to a double helix, signaling a shift from a commerce-focused drug manufacturer to a science-based medical leader. It’s likely no coincidence that this design coincided with its release of the COVID-19 vaccine. The launch was massively successful, with the January 2021 redesign driving a 59.77% increase in traffic.
Several sports leagues also dominate the chart. Major League Soccer (MLS) sits at number two with a nearly 48% jump, and the Premier League takes the third spot with a 35.83% increase. MLS ditched the literal soccer ball and boot graphic for a modular, customizable crest, while the Premier League similarly dropped the full-body lion and ball for a simple, regal lion head, both in an attempt to better appeal to consumers in the digital age.
Technology and social media platforms appear frequently but often deliver smaller percentage gains than those at the top of our list, likely because their baseline traffic was already quite high. Instagram, for example, saw a 7.17% increase after switching from the retro Polaroid camera to the gradient, sunset-colored graphic. While this isn’t the largest increase in website traffic, it still amounts to over 8 million clicks.
Further down the list, many of the effective logo redesigns were rewarded for simplifying. Burberry, YouTube, Visa, Mastercard, and Intel all moved toward cleaner, simpler designs that perform better on small screens or across devices.
The data clearly shows that a well-timed, well-executed logo redesign is a powerful marketing tool. While the immediate aftermath may invite criticism and hot takes, the long-term result of a successful refresh is a revitalized brand that feels current and relevant.
However, you don’t need to be a multinational corporation to benefit from a fresh look. Your brand deserves a logo that works on every screen and speaks directly to your customers, even if you don’t have a design background. If you’re ready to see what a professional, modern identity can do for your business, check out our AI-powered logo design tools today.
Logo Redesigns and Rebrands That Resulted in the Largest Traffic Increases
Methodology:
To identify the logo redesigns and rebrands that led to the largest increases in web traffic, we gathered monthly worldwide organic traffic estimates from Semrush for major brands that underwent a logo redesign or rebranding since 2012, the year Semrush began collecting this data. We compared each brand’s average organic traffic for the three months preceding the public announcement with the average organic traffic during the announcement month and the two months following it. Brands that experienced the largest increase in web traffic post-announcement were deemed to have the most successful logo redesigns and rebrands. Several brands on this list have redesigned their logos multiple times since 2012; some earlier redesigns have generated more web traffic than their more recent updates.
Organic Traffic (in millions)
| Rank | Brand | Month and Year of Logo Redesign/Rebrand Launch | Avg. Traffic Over the Three Months Before Launch | Traffic Three Months Before Launch | Traffic Two Months Before Launch | Traffic One Month Before Launch | Traffic During the Month of Launch | Traffic One Month After Launch | Traffic Two Months After Launch | Avg. Traffic Over the Three Months After Launch | Percentage Increase in Traffic Over the Three Months After Launch |
| 1 | Pfizer | January 2021 | 1.12 | 0.64 | 1.46 | 1.26 | 1.52 | 1.70 | 2.14 | 1.79 | 59.77% |
| 2 | MLS | September 2014 | 0.95 | 0.91 | 0.94 | 1.00 | 1.02 | 1.01 | 2.20 | 1.41 | 47.94% |
| 3 | Premier League | February 2016 | 7.73 | 7.32 | 7.75 | 8.10 | 10.66 | 10.44 | 10.38 | 10.50 | 35.83% |
| 4 | The Guardian | January 2018 | 131.88 | 133.44 | 135.19 | 127.03 | 170.14 | 163.43 | 169.06 | 167.54 | 27.04% |
| 5 | Southwest Airlines | September 2014 | 7.77 | 7.67 | 7.68 | 7.95 | 7.96 | 7.47 | 12.28 | 9.24 | 18.93% |
| 6 | Visa | January 2014 | 0.57 | 0.45 | 0.58 | 0.70 | 0.72 | 0.65 | 0.63 | 0.67 | 15.84% |
| 7 | Target | November 2018 | 74.13 | 79.05 | 61.13 | 82.21 | 86.85 | 87.33 | 81.85 | 85.35 | 15.13% |
| 8 | Jaguar | November 2024 | 0.40 | 0.33 | 0.50 | 0.37 | 0.44 | 0.51 | 0.42 | 0.46 | 14.71% |
| 9 | IHOP | June 2015 | 1.18 | 1.10 | 1.17 | 1.28 | 1.25 | 1.40 | 1.42 | 1.36 | 14.68% |
| 10 | Spotify | June 2015 | 5.27 | 4.49 | 5.55 | 5.77 | 5.38 | 5.98 | 6.67 | 6.01 | 14.06% |
| 11 | Burberry | August 2018 | 0.70 | 0.57 | 0.73 | 0.80 | 0.77 | 0.80 | 0.80 | 0.79 | 12.45% |
| 12 | Guinness | April 2016 | 0.13 | 0.13 | 0.13 | 0.14 | 0.15 | 0.15 | 0.15 | 0.15 | 12.43% |
| 13 | YouTube | August 2017 | 5,106 | 4,985 | 4,927 | 5,406 | 5,517 | 5,644 | 5,945 | 5,701 | 11.67% |
| 14 | Rolls-Royce | August 2020 | 2.20 | 2.14 | 2.25 | 2.20 | 2.38 | 2.37 | 2.56 | 2.44 | 10.85% |
| 15 | Olive Garden | March 2014 | 1.76 | 1.75 | 1.78 | 1.76 | 1.90 | 2.01 | 1.94 | 1.95 | 10.76% |
| 16 | Animal Planet | October 2018 | 2.49 | 2.96 | 2.35 | 2.17 | 2.55 | 2.70 | 2.94 | 2.73 | 9.63% |
| 17 | DuPont | October 2018 | 0.28 | 0.27 | 0.28 | 0.30 | 0.30 | 0.32 | 0.31 | 0.31 | 9.28% |
| 18 | Airbnb | July 2014 | 0.62 | 0.65 | 0.60 | 0.60 | 0.60 | 0.72 | 0.71 | 0.67 | 9.16% |
| 19 | Intel | September 2020 | 12.50 | 12.45 | 12.36 | 12.69 | 12.86 | 13.80 | 13.96 | 13.54 | 8.36% |
| 20 | Kroger | November 2019 | 8.49 | 8.16 | 8.79 | 8.53 | 8.43 | 9.09 | 10.04 | 9.19 | 8.17% |
| 21 | Uber | September 2018 | 27.44 | 27.84 | 26.62 | 27.84 | 29.43 | 29.92 | 29.50 | 29.62 | 7.96% |
| 22 | Pap Johns | November 2021 | 14.88 | 14.11 | 15.15 | 15.38 | 15.29 | 16.43 | 16.43 | 16.05 | 7.89% |
| 23 | Taco Bell | November 2016 | 3.79 | 3.80 | 3.77 | 3.81 | 3.74 | 4.22 | 4.24 | 4.07 | 7.30% |
| 24 | May 2016 | 121.22 | 116.75 | 120.35 | 126.55 | 130.35 | 132.02 | 127.35 | 129.91 | 7.17% | |
| 25 | Dropbox | October 2017 | 21.00 | 19.68 | 21.63 | 21.69 | 21.70 | 22.50 | 22.73 | 22.31 | 6.24% |
| 26 | Adobe | May 2020 | 61.22 | 62.21 | 60.90 | 60.55 | 62.93 | 65.52 | 66.10 | 64.85 | 5.93% |
| 27 | USA Today | September 2012 | 6.51 | 6.33 | 6.21 | 6.98 | 6.84 | 6.49 | 7.19 | 6.84 | 5.15% |
| 28 | Mastercard | January 2019 | 0.23 | 0.22 | 0.24 | 0.22 | 0.21 | 0.28 | 0.23 | 0.24 | 5.06% |
| 29 | Yahoo | September 2013 | 336.38 | 307.45 | 339.65 | 362.04 | 333.04 | 321.53 | 404.71 | 353.09 | 4.97% |
| 30 | Nissan | July 2020 | 6.86 | 6.74 | 6.82 | 7.02 | 7.05 | 7.06 | 7.38 | 7.16 | 4.46% |
| 31 | Aldi | March 2017 | 1.83 | 1.82 | 1.85 | 1.83 | 1.86 | 1.98 | 1.89 | 1.91 | 3.96% |
| 32 | Pizza Hut | June 2019 | 16.78 | 16.70 | 16.78 | 16.87 | 17.32 | 17.19 | 17.20 | 17.24 | 2.71% |
| 33 | Netflix | April 2014 | 20.05 | 20.65 | 19.21 | 20.28 | 20.30 | 20.29 | 20.18 | 20.26 | 1.05% |
| 34 | Century 21 | March 2018 | 1.99 | 1.77 | 1.82 | 2.39 | 1.88 | 2.11 | 2.05 | 2.01 | 1.04% |
| 35 | Kia | January 2021 | 17.80 | 17.81 | 17.82 | 17.80 | 17.86 | 17.85 | 18.24 | 17.98 | 0.98% |
Source: Semrush, Domain Overview: Organic Traffic https://www.semrush.com/.